
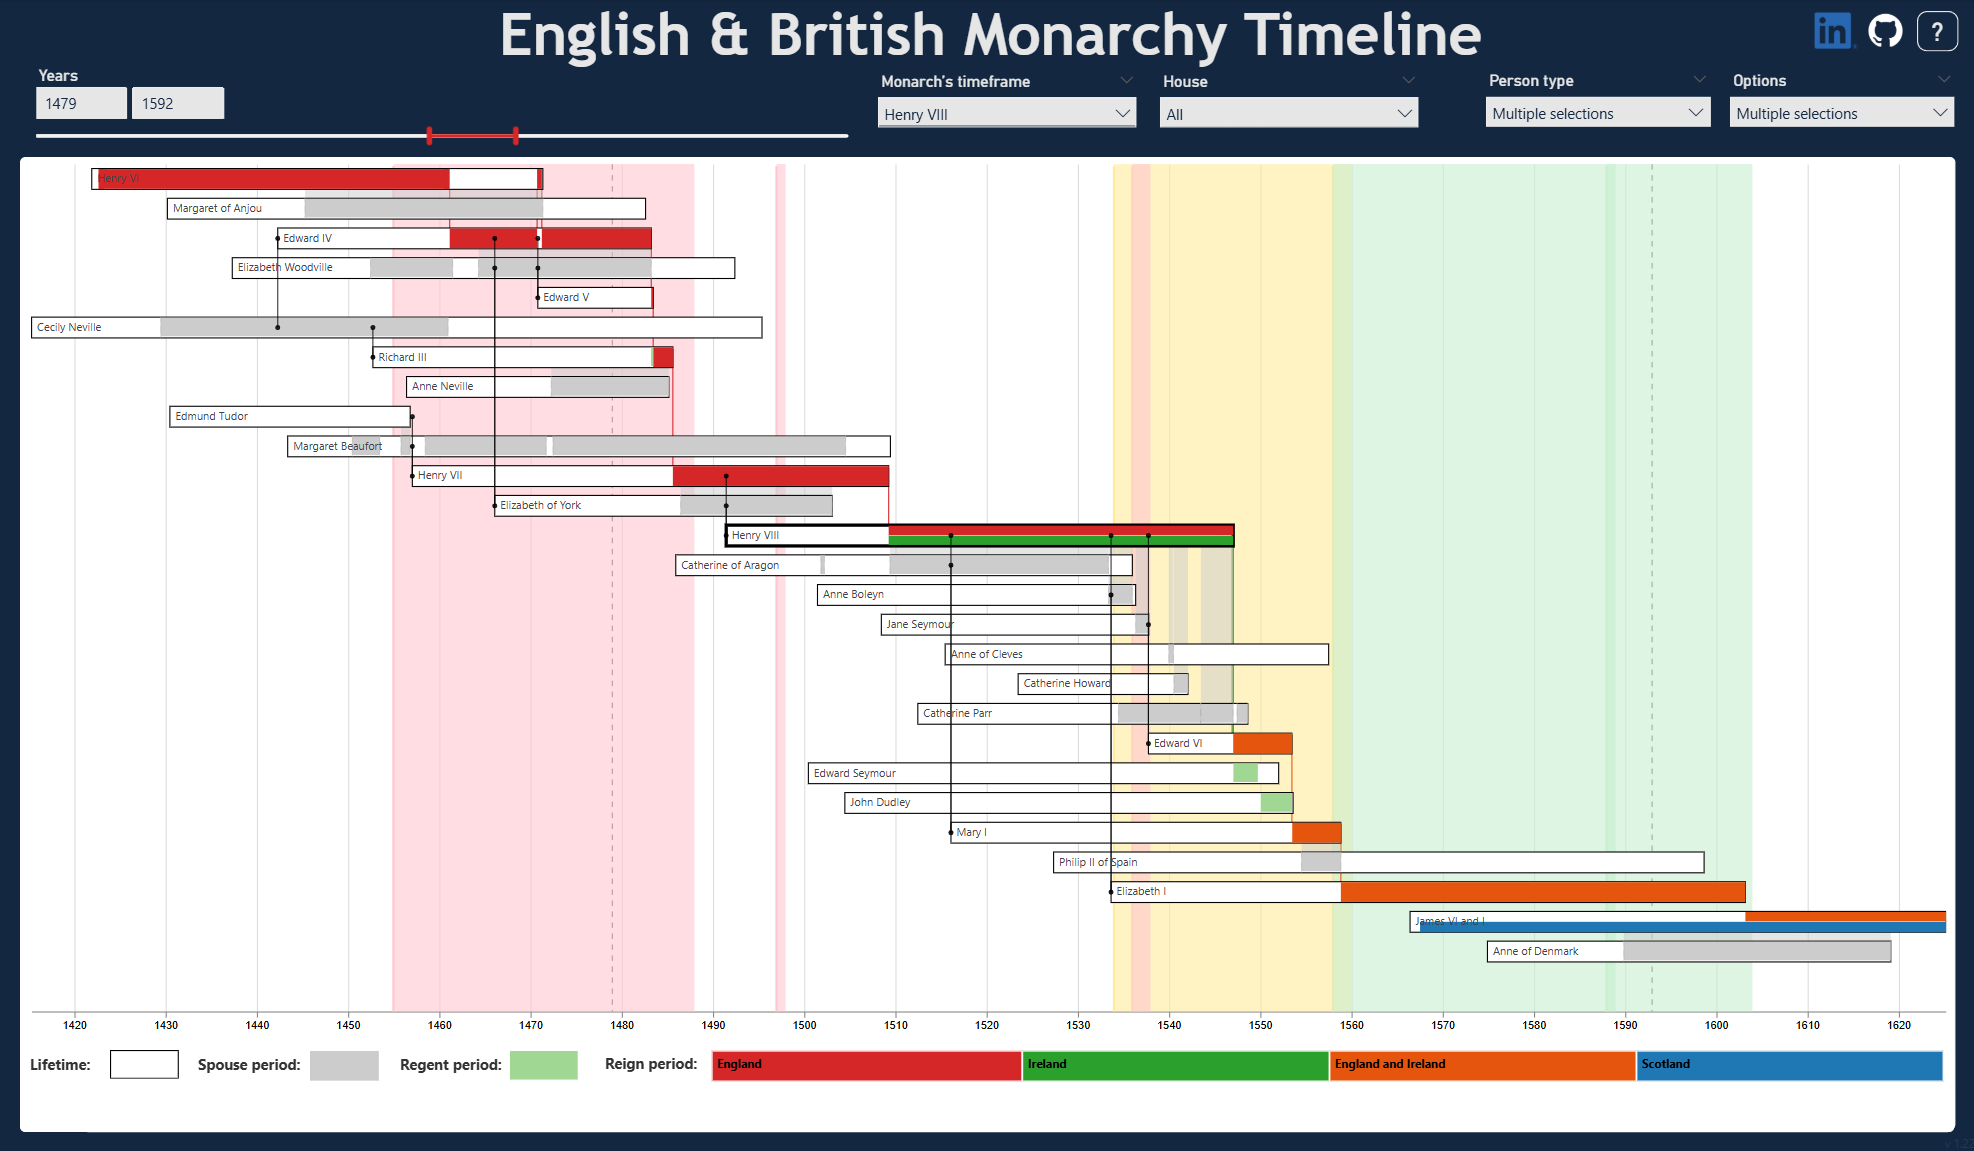
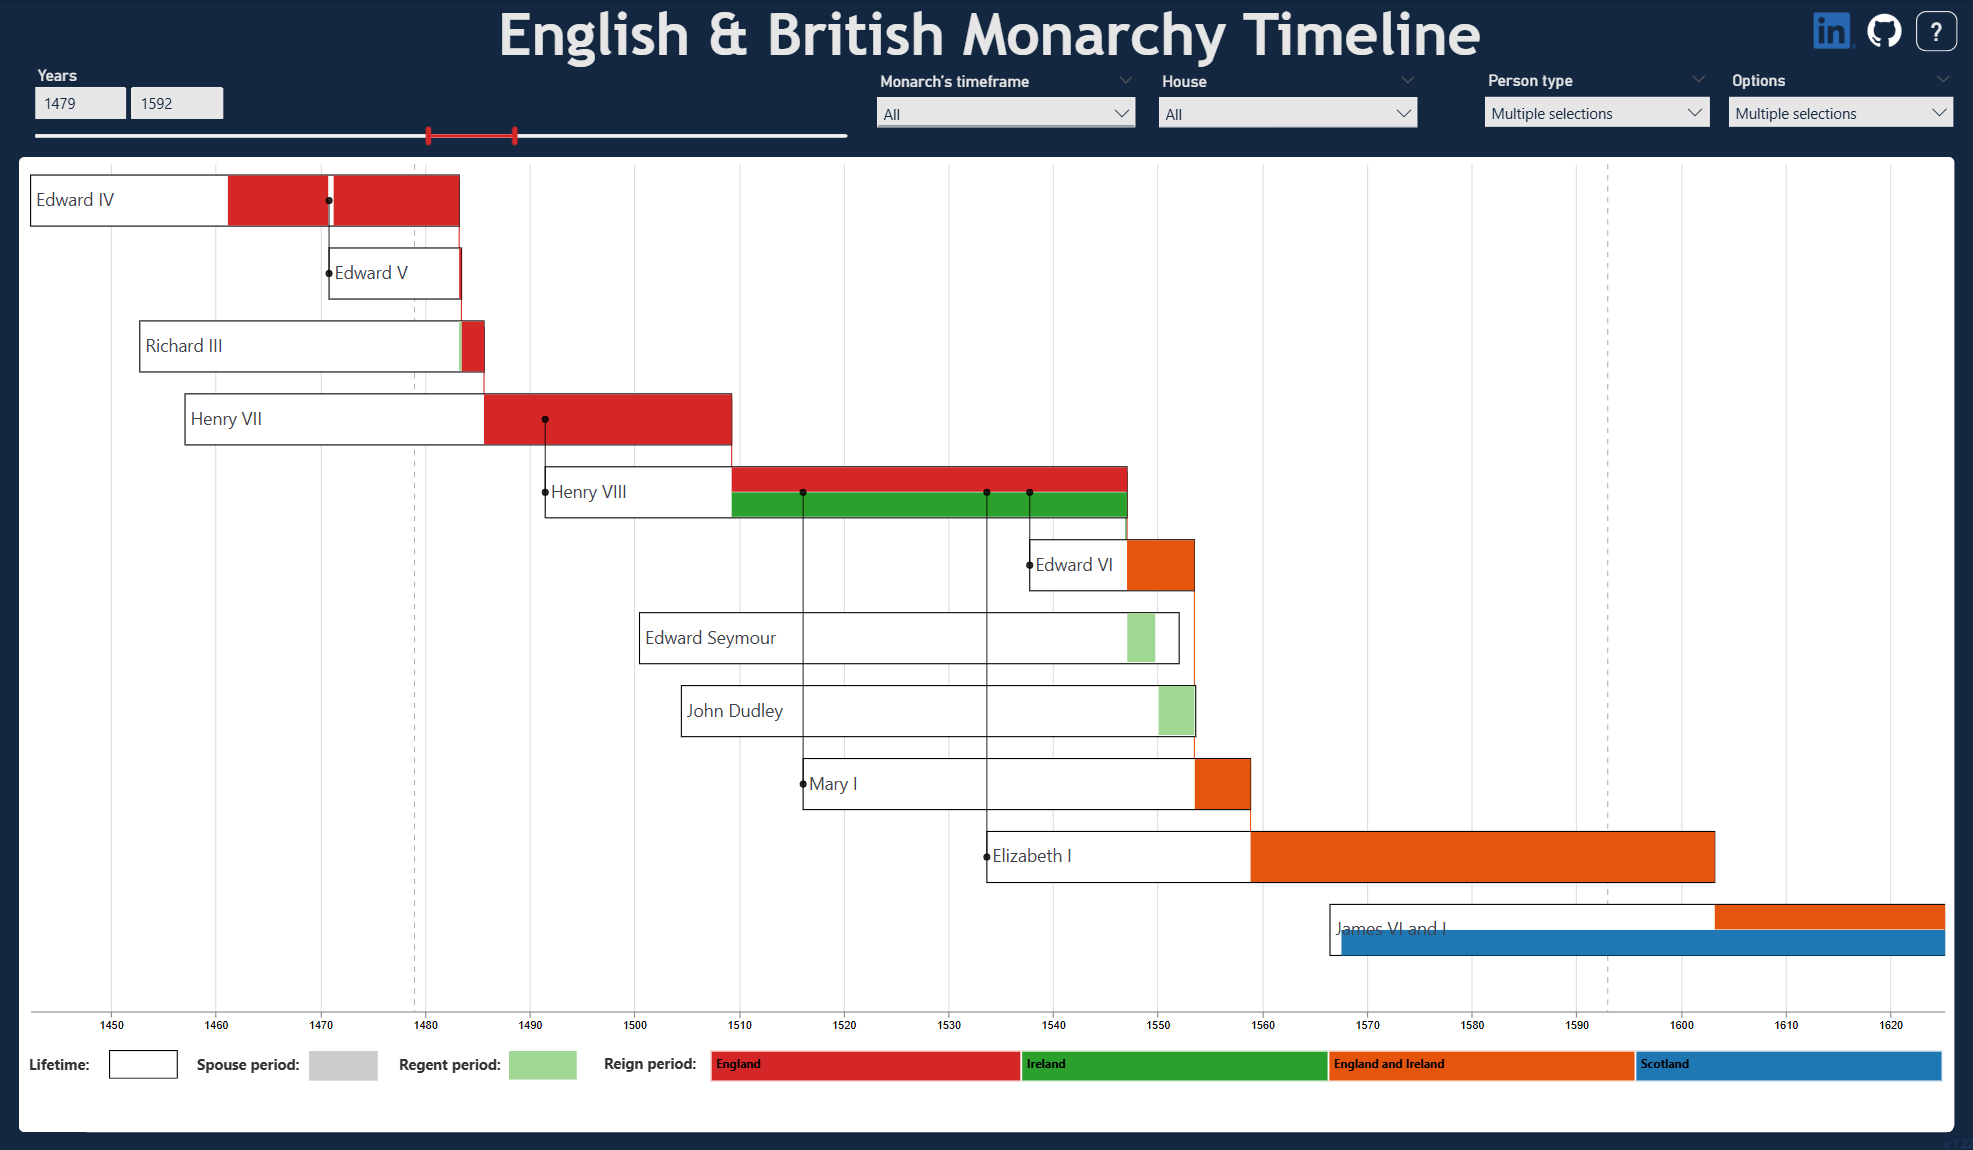
British Monarchy Timeline — From Data to Dynasty
An interactive Power BI visual that reimagines how we explore royal history.
Client-ready concept built with Power BI, Deneb, and VEGA — translating centuries of royal lineage into an intuitive analytical experience.
Why this timeline needed to exist
This project started from a simple need: I wanted a tool that could help me learn and better understand English and British history — particularly the complex web of monarchs, reigns, and dynasties.
Plain text or standard genealogical trees didn’t work for me. I needed something visual, dynamic, and interactive — a way to see how monarchs, houses, and reigns connected across time.
Challenge, solution, outcome
Challenge
No ready-made visual could combine chronology, relationships, and context.
Solution
Built a bespoke VEGA visual in Power BI using Deneb, connecting reigns, houses, and successions.
Outcome
A dynamic, interactive tool for exploring more than a millennium of royal lineage.
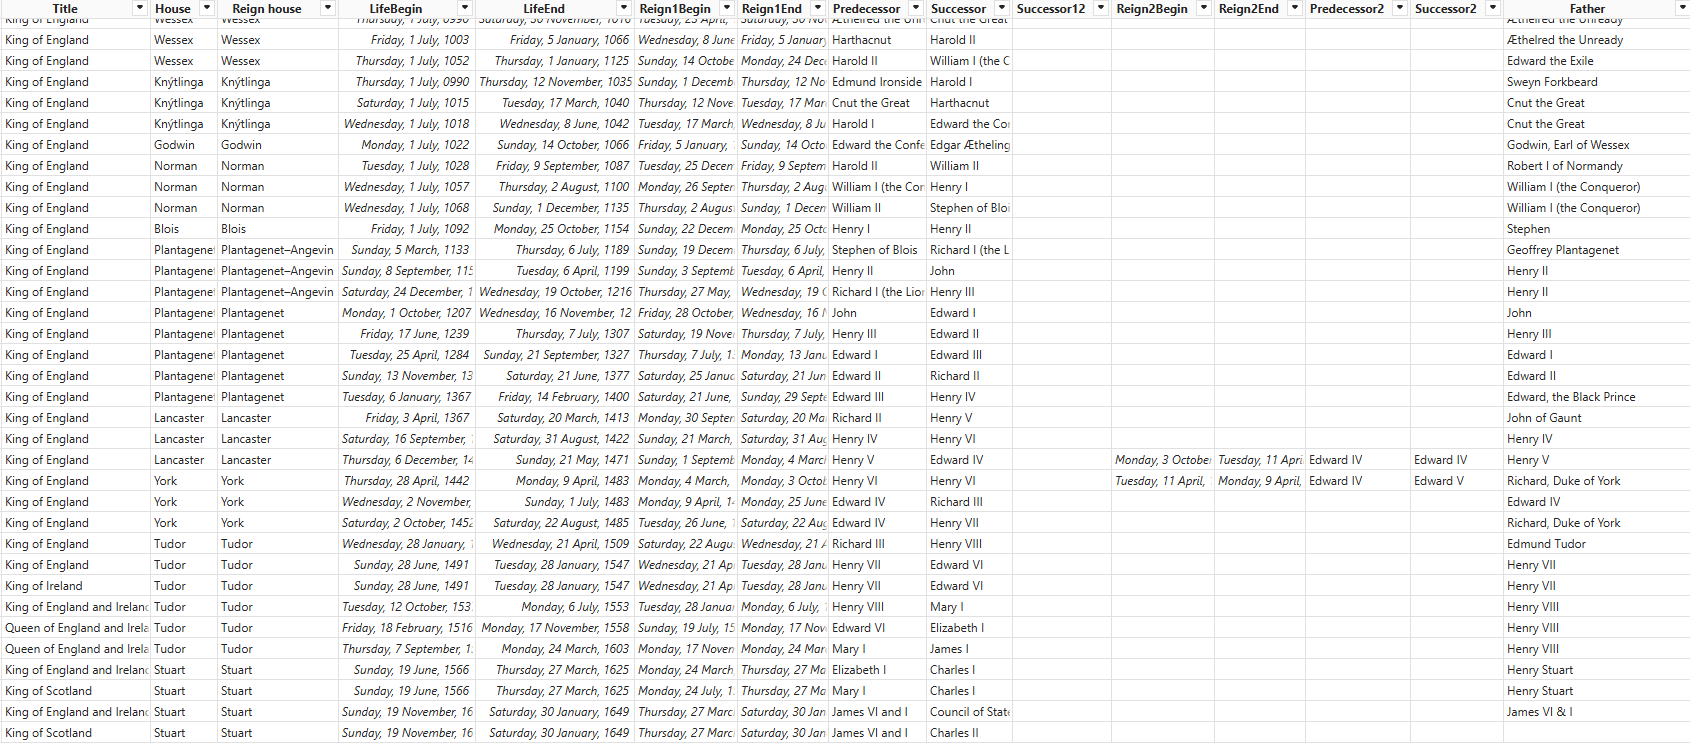
From raw data to immersive visual storytelling
Every element — from data shaping to visual specification — was crafted to help history enthusiasts explore lineage, alliances, and succession at a glance.

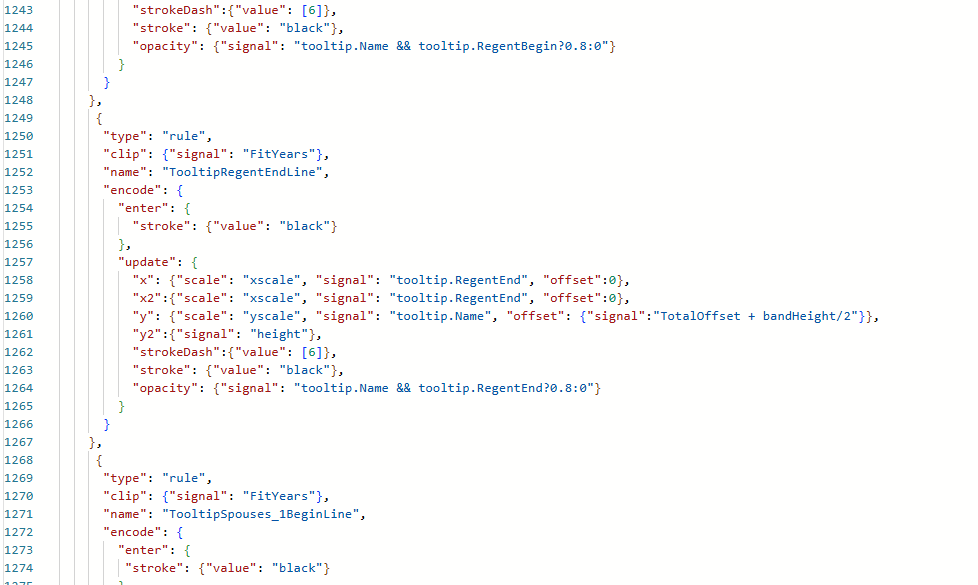
Dive into the live build and the code
See the interactive timeline in action or review the VEGA specification on GitHub.